
Many years ago we found a 1954 publication, How to Lie With Statistics by Darrell Huff. There were a number of useful thoughts in this book, which was an introductory presentation of how to use, and abuse, statistical data.
If your responsibilities include data presentation, beware of truncated graphs that show only the tops of bars, or eliminate the range from zero to wherever you are tempted to start. Below is an excellent example.
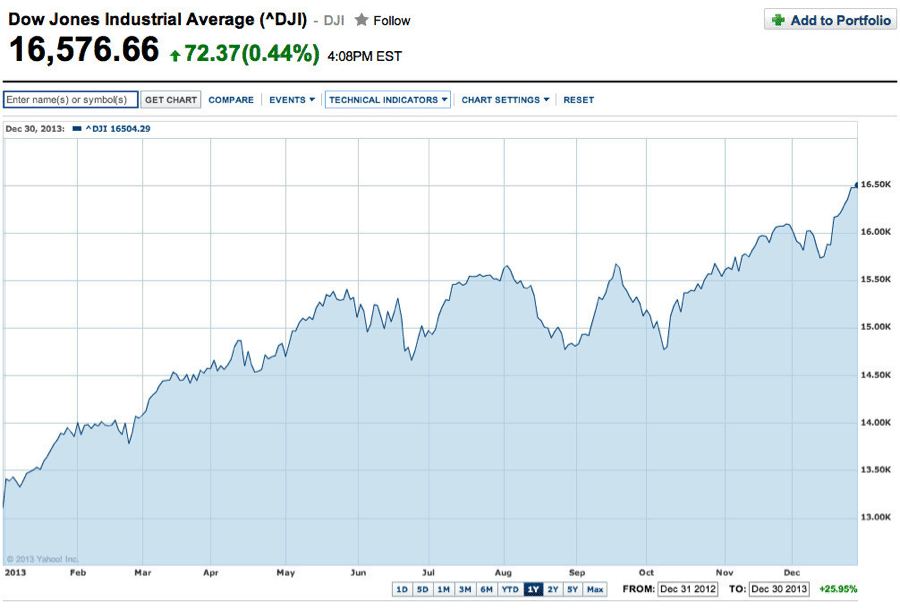
The graph shows Dow Jones 2013 growth: slightly above 13,000 on 12/31/12 to 16, 576 on 12/30/13. This is growth of 26%. Note, however, the graph point on 12/30/13 is nearly 7 times as high as at the beginning of the graph. Does it look like 26% to you?
There are very many examples of distortion in data presentation, and one of the most common is to show a bar chart or graph that begins at some point far from zero. The data presented thus shows only a truncated picture, where variations appear very large, as in this example. In fact they are far less. This technique is widely used in political data, in order to emphasize a point through exaggeration—whether intended or not.
For several excellent examples of this, here is a link to a website that shows how the data presentation distorts reality: https://bi.abhinavagarwal.net/2013/07/lying-with-charts-global-warming-graph.html
We have no view on the subject of these graphs and charts; rather we wish to point out to be careful to look at where the data begins. A good thought is to ensure you know where zero would be on the graph or chart you are observing. It could make a big difference.
