
Many years ago we found a 1954 publication, How to Lie With Statistics by Darrell Huff. There were a number of useful thoughts in this book, which was an introductory presentation of how to use, and abuse, statistical data. This ssubject is important enough to warrant another article. All of us are subject to statistical presentations that may tell a distorted story. Beware!
If you are at all attentive to graphs, charts, and related presentations you are doubtless subjected to distortions on a regular basis. No matter the source, the techniques are simply ubiquitous.
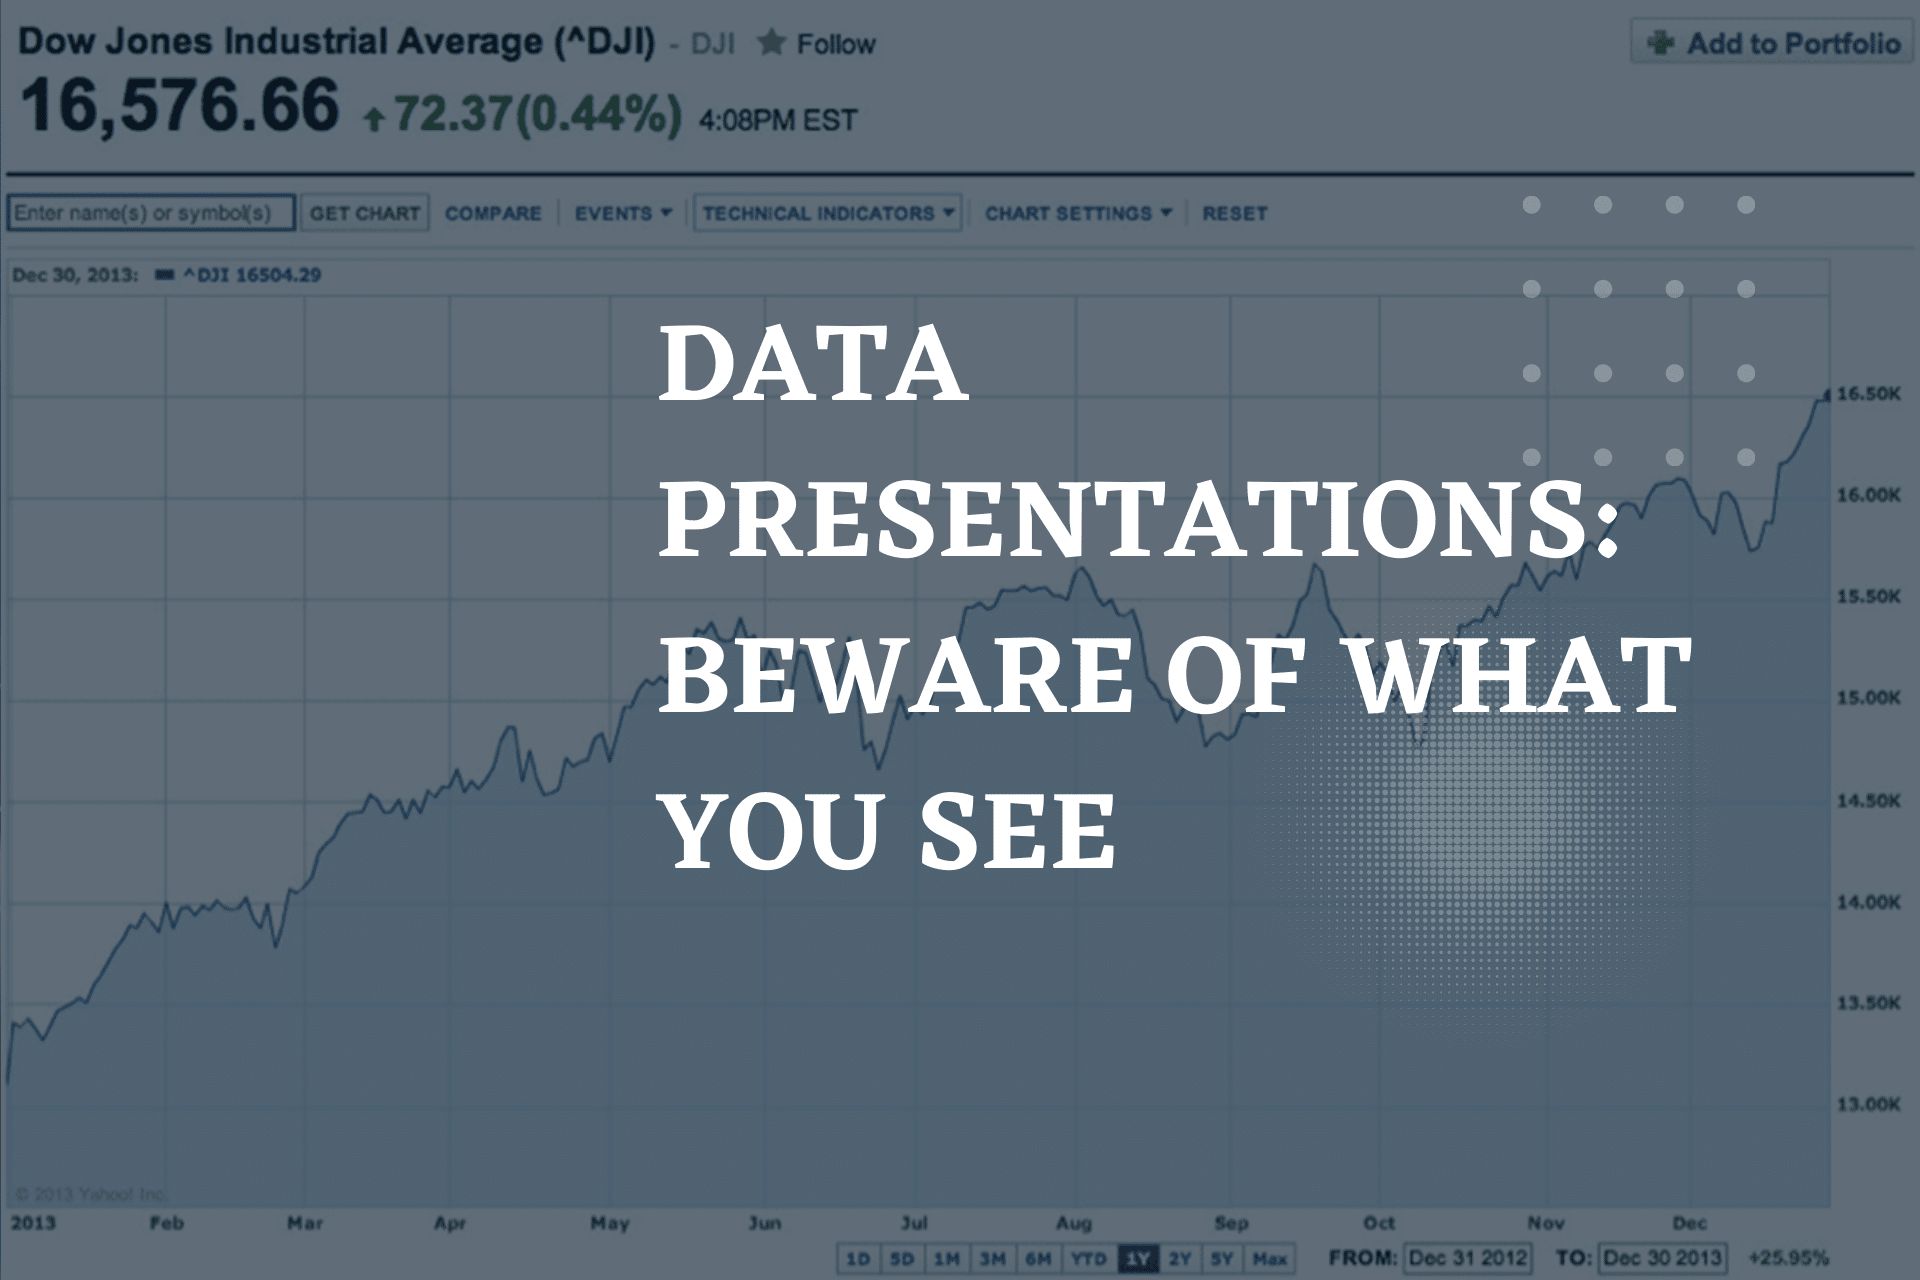
Perhaps your responsibilities include data presentation with truncated graphs that show only the tops of bars, or eliminate the range from zero to wherever you are tempted to start. This is a very common way to emphasize a point by using distortion. Below is an excellent example from an nearly infinite number of examples.
The graph shows Dow Jones 2013 growth: slightly above 13,000 on 12/31/12 to 16, 576 on 12/30/13. This is growth of 26% over the year of 2013. Note, however, the graph point on 12/30/13 is nearly 7 times as high as at the beginning of the graph. Does it look like 26% to you? (What the 44% refers to has been lost to time.)
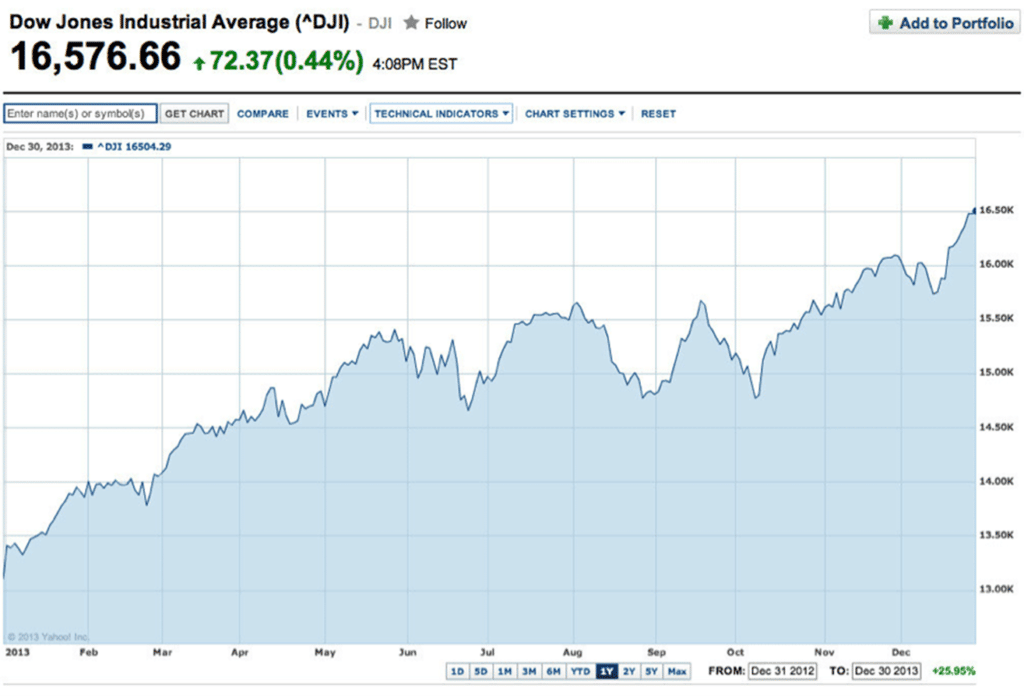
There are very many examples of distortion in data presentation, and one of the most common, like the Dow Jones example, is to show a bar chart or graph that begins at some point far from zero. The data presented thus shows only a truncated picture, where variations appear very large, as in this example. In fact they are far less. This technique is widely used in political data, in order to emphasize a point through exaggeration—whether intended or not.
For several excellent examples of this, here is a link to a website that shows how the data presentation distorts reality and can be presented in many different ways.
We have no view on the subject of these graphs and charts; rather we wish to point out to be careful to look at where the data begins and what form it takes. A good thought is to ensure you know where zero would be on a graph or chart you are observing. It could make a big difference in a conclusion..
It’s also a good idea to be aware of the probable bias of the source of the data, particularly with political presentations. Some sources just can’t help themselves, or perhaps it’s intentional bias.
Another technique that’s particularly amusing is to extrapolate something beyond reasonable limits. In the book mentioned above, there’s a quote about the lengthening of the Mississippi River annually, which if extended for a great many years means the Mississippi would circle the earth several times. Rate of change may not continue indefinitely!
Speaking of which, we recall a Peter Jennings comment on his ABC nightly news that women’s track sprinting times were improving at a faster rate than men’s, so at some point women will be running faster than men. Do you think future Usain Bolts are worried? We do not.
We think it’s always a good idea to take data presentations with a grain of salt. It’s likely to lessen mistakes and that’s a very good thing.
